

 Facebook
 X
X
 Pinterest
 Copy Link
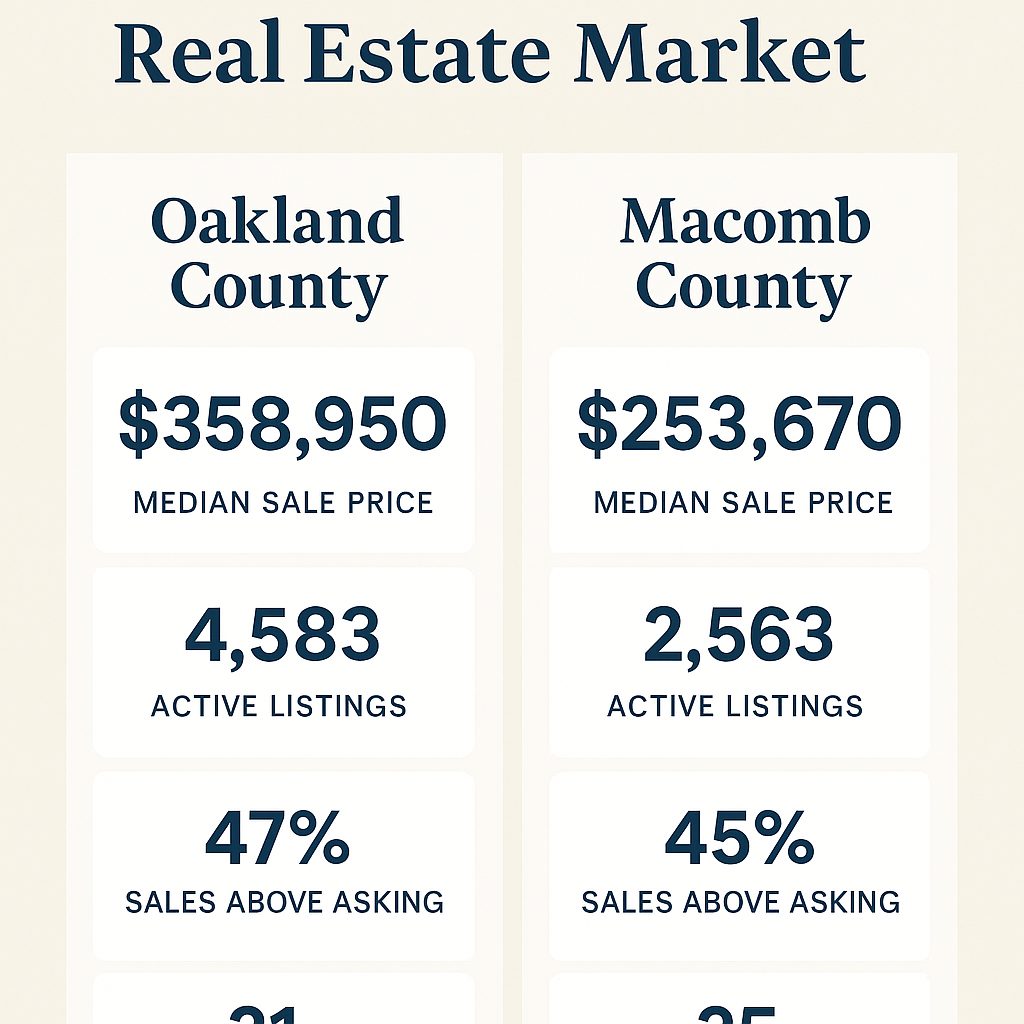
📍 Oakland County
-
Median sold price: ~$359K–376K • up ~4–5% YoY redfin.com+2rocket.com+2thepernateam.com+2
-
Average days on market: 15–22 days, up from ~13–18 days last year redfin.com+1thepernateam.com+1
-
Market conditions: Still a seller’s market — almost half of homes sold above asking, majority under 30 days houzeo.com+4rocket.com+4rocket.com+4
🔍 Interpretation:
Homes are selling relatively quickly with rising prices and frequent bidding wars. Still favoring sellers but signs indicate slightly softening (rising DOM).
📍 Macomb County
-
Median sold price: ~$253K–274K • up ~5–9.6% YoY thepernateam.com+3redfin.com+3rocket.com+3
-
Average days on market: 16 days (up from ~10 last year); other sources say ~29–31 days realestateone.com+2redfin.com+2thepernateam.com+2
-
Realtor.com: ~29 days
-
Redfin: 16 days fred.stlouisfed.org+2redfin.com+2en.wikipedia.org+2
-
FRED (Realtor): ~32 days zillow.com+13fred.stlouisfed.org+13realtor.com+13
-
-
Market conditions: Generally a seller’s market — sale-to-list price ~99.8%, ~44–45% sold over list price thepernateam.com+2redfin.com+2houzeo.com+2
🔍 Interpretation:
Strong annual price growth and high sell-through ratios mean sellers hold the advantage. The discrepancy in DOM (16 vs ~30 days) likely stems from data source differences — it’s still turning homes faster than balanced markets.
📊 Summary Table
| County | Median Price | Days on Market | Market Type |
|---|---|---|---|
| Oakland County | $359K–376K | 15–22 days | Seller’s market |
| Macomb County | $253K–274K | ~16–32 days | Seller’s market |
🧭 Final Takeaway
Both counties remain seller-favored markets, with strong price appreciation and homes selling faster than in neutral conditions. Inventory is up, and days on market has edged higher—signs of slight market cooling, but sellers still hold the upper hand.

")

